You are using an out of date browser. It may not display this or other websites correctly.
You should upgrade or use an alternative browser.
You should upgrade or use an alternative browser.
Ietls writing - Day 10
- Tạo bởi Thạch Sinh
- Start date
-
- Thẻ mô tả
- english
xamvner234
Bò lái xe
bài này tao sửa dựa theo cái outline của mầy, còn tao sẽ làm và up riêng cho mày tham khảo
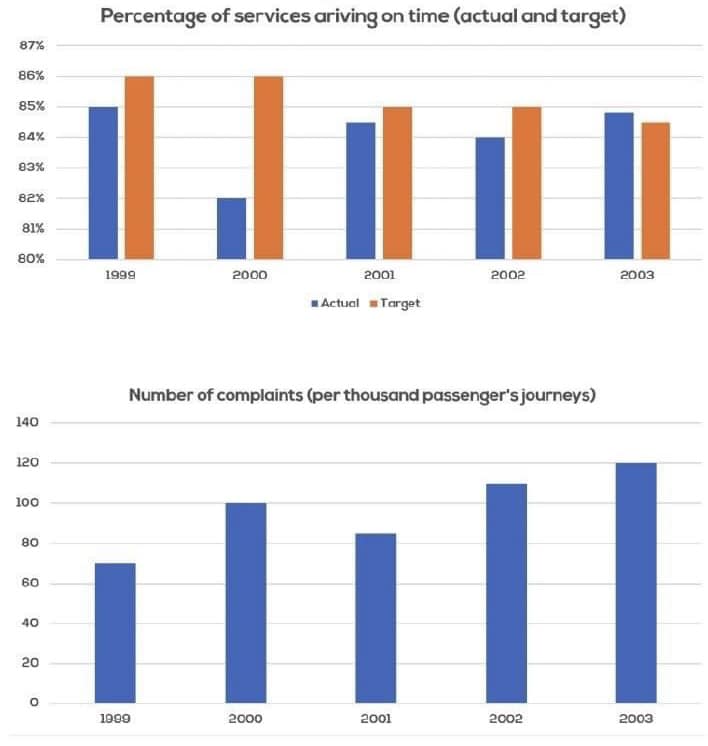
The graphs illustrate the performance of a transportation company in terms of the percentage of services arriving on time and the number of passenger complaints received between 1999 and 2003.
In the overview, it is evident that the company gradually improved its punctuality over this period, ultimately reaching its target in 2003. Conversely, the number of complaints from passengers increased.
Regarding the measurement of on-time service arrivals, in 1999, the company nearly achieved its target with 85% of total buses arriving on time, just shy of the 86% goal. However, performance experienced a significant drop the following year, reaching its lowest point of 82%. Subsequently, the company consistently lowered its target from 86% in 2000 to 84.5% in 2003. With these adjustments, the company eventually met its goal in 2003, with approximately 85% of total buses adhering to the schedule, compared to the goal of 84.5%.
On the other hand, the number of complaints received increased steadily over the period. In 1999, only 70 per thousand passengers expressed dissatisfaction with the services provided. By the end of 2003, the company had received 120 complaints per thousand customers served, marking a 70% increase.
xamvner234
Bò lái xe
bài này tao viết, đọc và chiêm nghiệm đi tmlThe charts below show the performance of a bus company in terms of punctuality, both actual and target (what actually happened compared to what the company was trying to achieve), and the number of complaints and passengers.
The graphs demonstrate the performance of a transportation company regarding to the percentage of services arriving on time and the number of complaints received from passengers between 1999 and 2003.
In overview, the company gradually decreased its target over the period and ultimately reached its goal in 2003. In contrast, the service received more complaints from passengers.
In terms of measuring on-time arriving services, in 1999, the firm nearly achieved its target with 85% of total buses arriving on time compared to the target of 86%. However, the performance experienced a significant drop next year, to its lowest point of 82%. Afterwards, the firm constantly lowered its target from 86% in 2000 to 84.5% in 2003. With these adjustments, the company eventually meet its target in 2003, with approximately 85% of total buses on track compared to the goal of 84.5%.
On the other hand, the number of complaints received had increased constantly over the period. In 1999, only 70 per thousand passengers were not satisfied with the services provided. By the end of 2003, the company had received 120 complaints over a thousand customers served, experienced an increase of 70%.
@horus @xamvner234 @suchawanderer @TatHuan
The initial chart illustrates the on-time arrival percentages of buses operated by a specific company between 1999 and 2003, comparing the actual performance to the set targets. Meanwhile, the second chart details the number of passenger complaints filed during the same time frame.
It is evident that the targeted on-time arrival rate for buses decreased gradually over the years, while the actual percentage of buses meeting this target exhibited no distinct pattern. Additionally, passenger complaints consistently increased throughout the period.
In 1999, the company aimed for an 86% on-time arrival rate, slightly surpassing the achieved rate by 1%. Although the target remained constant in the subsequent year, on-time arrivals decreased by nearly 3%. By 2003, the company had lowered its on-time arrival target to slightly above 84%, while the actual performance had notably increased to around 85%.
Commencing at approximately 7% of total passengers in 1999, the number of passenger complaints experienced significant growth before a minor decline to slightly over 8% in 2001. Subsequently, this figure exhibited substantial growth, reaching approximately 12% in the final year.
suchawanderer
Thanh niên hoi
xam nà melting pot.. chính chị zăn quá khoa học kỉ thuật ngoại ngử vú Lồn ăn chơi j củng coá..Đụ má lên đây luyện English là 1 sai lầm. Muốn luyện thì vào forum nước ngoài mà luyện. Đang giữa chừng có thằng lên bài Ninh Dương Lan Ngọc thì lại bỏ dở, qua đó xem sookak xong mệt quá đi ngủ.
Forum nào cho tao xin cái link với mày. Mà vấn đề là t thích văn hoá trong xàm nên muốn tạo động lực cho aeĐụ má lên đây luyện English là 1 sai lầm. Muốn luyện thì vào forum nước ngoài mà luyện. Đang giữa chừng có thằng lên bài Ninh Dương Lan Ngọc thì lại bỏ dở, qua đó xem sookak xong mệt quá đi ngủ.
Chi xiwodd
Cái lồn nhăn nheo
M khoái chủ đề nào thì kêu gọi ae đi dịch bài ấy. T nghĩ cũng hay, vừa đóng góp vừa nâng trìnhForum nào cho tao xin cái link với mày. Mà vấn đề là t thích văn hoá trong xàm nên muốn tạo động lực cho ae
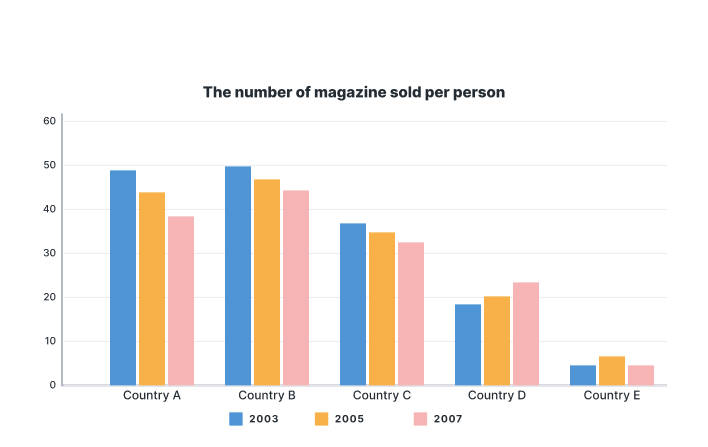
The graph demonstrates the total sales of magazines in five different countries between 2003 and 2005, with the predicted number for the year 2007.
Overall, almost all countries experienced a slight decrease in the number of magazine sold from 2003 to 2005. It is predicted that the sales revenue in 2007 will roughly follow the same pattern in these nations.
It is clear that country B was the leading magazines seller in 2003 and 2005, with approximately 50 and 47 products sold per person. This country is predicted to maintain its position in 2007, with the total of 44 magazines sold per person.
Country D was the only one having total sales increased over the period. In 2003, this nation had about 18 magazines sold and the number rose to 20 in 2005, and predicted to reach 22 in 2007. On the other hand, despite having sales revenue increased slightly in the period, the number of magazines sold in country E is projected to drop in 2007.
@horus @xamvner234 @TatHuan @Chi xiwodd @suchawanderer đm tag riết tao nhớ tên tụi mày luôn
mrsimply52
Khổ vì lồn
learn English with xammer.png "Sex :vozvn (21):")
xamvner234
Bò lái xe
sao mày dùng magazine sold nhiều vậy ? tìm synonym thay thế cho nó đi tml
The graph demonstrates the total sales of magazines in five different countries between 2003 and 2005, with the predicted number for the year 2007.
Overall, almost all countries experienced a slight decrease in the number of magazine sold from 2003 to 2005. It is predicted that the sales revenue in 2007 will roughly follow the same pattern in these nations.
It is clear that country B was the leading magazines seller in 2003 and 2005, with approximately 50 and 47 products sold per person. This country is predicted to maintain its position in 2007, with the total of 44 magazines sold per person.
Country D was the only one having total sales increased over the period. In 2003, this nation had about 18 magazines sold and the number rose to 20 in 2005, and predicted to reach 22 in 2007. On the other hand, despite having sales revenue increased slightly in the period, the number of magazines sold in country E is projected to drop in 2007.
@horus @xamvner234 @TatHuan @Chi xiwodd @suchawanderer đm tag riết tao nhớ tên tụi mày luôn.png "Sex :vozvn (49):")
the number rose to 20 in 2005, and predicted to reach 22 in 2007 => the number rose to 20 in 2005 and is predicted to reach 22 in 2007
enhanced version
The graph illustrates the total sales of magazines in five different countries between 2003 and 2005, along with the projected figures for 2007.
In general, nearly all countries witnessed a slight decline in magazine sales from 2003 to 2005, and it is anticipated that this trend will continue in 2007.
It is evident that Country B led in magazine sales in both 2003 and 2005, with approximately 50 and 47 magazines sold per person, respectively. This trend is expected to persist in 2007, with an estimated 44 magazines sold per person.
Country D was the only nation to experience an increase in total sales over the period. In 2003, this country had approximately 18 magazines sold per person, a number that rose to 20 in 2005, and is projected to reach 22 in 2007. Conversely, despite a slight increase in sales revenue during the same period, the number of magazines sold in Country E is forecasted to decline in 2007.
The table below gives information about salaries of secondary/high school teachers in five countries in 2009.
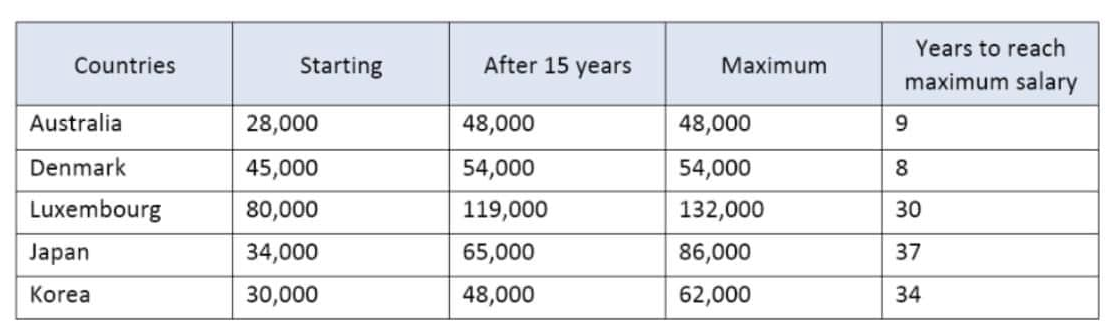
The table demonstrates the base salary offered for school teachers in five different countries and how it increased based on years of dedication, reported in 2009.
In overview, the based salary of educational workers vary from countries to countries, ranging from 28,000 to 80,000. Additionally, while some countries require less than 10 years to reach the highest earning level, the others ask for more than 30 years of dedication.
It is evident that Luxembourg pays the most, with starting salary of 80,000 and maximum salary of 132,000. Conversely, Australia offers the lowest salary level, with only 28,000 and 48,000 respectively.
Noticeably, Australia and Denmark are those requiring the least working years to reach the maximum earnings, only 8 and 9 years respectively. On the other hand, it takes approximately four times longer to reach the highest level in Japan and Korea. However, in these two asian nations, school teachers have the potential to double their income after reaching the salary bar.
Bài này tao viết tới 30 phút @xamvner234 @TatHuan
The table demonstrates the base salary offered for school teachers in five different countries and how it increased based on years of dedication, reported in 2009.
In overview, the based salary of educational workers vary from countries to countries, ranging from 28,000 to 80,000. Additionally, while some countries require less than 10 years to reach the highest earning level, the others ask for more than 30 years of dedication.
It is evident that Luxembourg pays the most, with starting salary of 80,000 and maximum salary of 132,000. Conversely, Australia offers the lowest salary level, with only 28,000 and 48,000 respectively.
Noticeably, Australia and Denmark are those requiring the least working years to reach the maximum earnings, only 8 and 9 years respectively. On the other hand, it takes approximately four times longer to reach the highest level in Japan and Korea. However, in these two asian nations, school teachers have the potential to double their income after reaching the salary bar.
Bài này tao viết tới 30 phút
task này t thấy rất tốt cho thằng làm data analys như m, viết cũng là học, m thấy có cửa làm remote DA cho tây lông kThe table below gives information about salaries of secondary/high school teachers in five countries in 2009.
The table demonstrates the base salary offered for school teachers in five different countries and how it increased based on years of dedication, reported in 2009.
In overview, the based salary of educational workers vary from countries to countries, ranging from 28,000 to 80,000. Additionally, while some countries require less than 10 years to reach the highest earning level, the others ask for more than 30 years of dedication.
It is evident that Luxembourg pays the most, with starting salary of 80,000 and maximum salary of 132,000. Conversely, Australia offers the lowest salary level, with only 28,000 and 48,000 respectively.
Noticeably, Australia and Denmark are those requiring the least working years to reach the maximum earnings, only 8 and 9 years respectively. On the other hand, it takes approximately four times longer to reach the highest level in Japan and Korea. However, in these two asian nations, school teachers have the potential to double their income after reaching the salary bar.
Bài này tao viết tới 30 phút
tao đang học DE chắc nhiều job remote hơn DA đúng k m
Ừa DE làm remote dễ hơn, mà m phải học đúng cái đang cần nữa. Nhưng quan trọng nhất là có Ielts.task này t thấy rất tốt cho thằng làm data analys như m, viết cũng là học, m thấy có cửa làm remote DA cho tây lông k
tao đang học DE chắc nhiều job remote hơn DA đúng k m
Cái đang cần là cái gì m, tao học SQL -> ETL -> DWH, DLake, Datamart thế thôi + kĩ năng SE nữa tuyển mid và sen nhiều lắm t thấy đang rất thiếu người làm DE đấyỪa DE làm remote dễ hơn, mà m phải học đúng cái đang cần nữa. Nhưng quan trọng nhất là có Ielts.
Mấy cái mày nói nó là khái niệm thôi, còn m phải học thêm kĩ năng nữa. T nghĩ SE khác nhiều so với DE đó mày. DE nó liên quan nhiều hơn đến data flowCái đang cần là cái gì m, tao học SQL -> ETL -> DWH, DLake, Datamart thế thôi + kĩ năng SE nữa tuyển mid và sen nhiều lắm t thấy đang rất thiếu người làm DE đấy
xamvner234
Bò lái xe
The table demonstrates the base salary offered for school teachers in five different countries. => the table demonstrates the base salary offered to school teachers in five different countriesThe table below gives information about salaries of secondary/high school teachers in five countries in 2009.
The table demonstrates the base salary offered for school teachers in five different countries and how it increased based on years of dedication, reported in 2009.
In overview, the based salary of educational workers vary from countries to countries, ranging from 28,000 to 80,000. Additionally, while some countries require less than 10 years to reach the highest earning level, the others ask for more than 30 years of dedication.
It is evident that Luxembourg pays the most, with starting salary of 80,000 and maximum salary of 132,000. Conversely, Australia offers the lowest salary level, with only 28,000 and 48,000 respectively.
Noticeably, Australia and Denmark are those requiring the least working years to reach the maximum earnings, only 8 and 9 years respectively. On the other hand, it takes approximately four times longer to reach the highest level in Japan and Korea. However, in these two asian nations, school teachers have the potential to double their income after reaching the salary bar.
Bài này tao viết tới 30 phút
with starting salary of 80,000 and maximum salary of 132,000=> with a starting salary of 80,000 and a maximum salary of 132,000
xamvner234
Bò lái xe
bài này tao viết, mày tham khảoThe table below gives information about salaries of secondary/high school teachers in five countries in 2009.
The table demonstrates the base salary offered for school teachers in five different countries and how it increased based on years of dedication, reported in 2009.
In overview, the based salary of educational workers vary from countries to countries, ranging from 28,000 to 80,000. Additionally, while some countries require less than 10 years to reach the highest earning level, the others ask for more than 30 years of dedication.
It is evident that Luxembourg pays the most, with starting salary of 80,000 and maximum salary of 132,000. Conversely, Australia offers the lowest salary level, with only 28,000 and 48,000 respectively.
Noticeably, Australia and Denmark are those requiring the least working years to reach the maximum earnings, only 8 and 9 years respectively. On the other hand, it takes approximately four times longer to reach the highest level in Japan and Korea. However, in these two asian nations, school teachers have the potential to double their income after reaching the salary bar.
Bài này tao viết tới 30 phút
The provided table presents a comparative analysis of the annual earnings of secondary school teachers in five distinct nations during the year 2009.
In summary, it is evident that Luxembourg offered the highest teacher salaries, although their journey to attain the maximum pay scale was notably lengthy. Conversely, teachers in Australia and Denmark, despite falling within the lower salary range, managed to reach the maximum salary level relatively quickly.
Luxembourg emerged as the country with the most substantial initial income for its teachers, with an annual salary of $80,000. Over a span of 15 years, their earnings escalated to $112,000, requiring three decades to reach the pinnacle of $139,000. On the contrary, Australia and Denmark exhibited a distinct trend. In these nations, teachers could attain the maximum salary in fewer than ten years; however, the overall salary range was among the lowest, peaking at $48,000 in Australia and $54,000 in Denmark.
Korea and Japan had the lengthiest duration for teachers to attain the maximum salary, requiring 37 and 34 years, respectively. Additionally, these countries presented the lowest initial salaries, with an average of $30,500 for teachers in Korea and $28,000 in Japan.
Ụ á m viết hay quá. Mà trình này phải tầm band >8. Tao chỉ target 6-7 thui. M sửa bài viết tầm band 7 - 7.5 thui được k. Cao quá tao lụm đéo vôbài này tao viết, mày tham khảo
The provided table presents a comparative analysis of the annual earnings of secondary school teachers in five distinct nations during the year 2009.
In summary, it is evident that Luxembourg offered the highest teacher salaries, although their journey to attain the maximum pay scale was notably lengthy. Conversely, teachers in Australia and Denmark, despite falling within the lower salary range, managed to reach the maximum salary level relatively quickly.
Luxembourg emerged as the country with the most substantial initial income for its teachers, with an annual salary of $80,000. Over a span of 15 years, their earnings escalated to $112,000, requiring three decades to reach the pinnacle of $139,000. On the contrary, Australia and Denmark exhibited a distinct trend. In these nations, teachers could attain the maximum salary in fewer than ten years; however, the overall salary range was among the lowest, peaking at $48,000 in Australia and $54,000 in Denmark.
Korea and Japan had the lengthiest duration for teachers to attain the maximum salary, requiring 37 and 34 years, respectively. Additionally, these countries presented the lowest initial salaries, with an average of $30,500 for teachers in Korea and $28,000 in Japan.
xamvner234
Bò lái xe
band 7.5Ụ á m viết hay quá. Mà trình này phải tầm band >8. Tao chỉ target 6-7 thui. M sửa bài viết tầm band 7 - 7.5 thui được k. Cao quá tao lụm đéo vô
The table shows how much money secondary school teachers in five different countries made each year in 2009.
In short, Luxembourg paid its teachers the most, but it took a long time to reach the highest salary. On the other hand, teachers in Australia and Denmark earned less, but they got to the highest salary faster.
Luxembourg started with the highest teacher salary at $80,000 per year. It took them 15 years to get to $112,000 and 30 years to reach the highest salary of $139,000. In contrast, Australia and Denmark had a different pattern. In these countries, teachers could reach the highest salary in less than ten years, but their overall salary was lower, with a peak of $48,000 in Australia and $54,000 in Denmark.
Korea and Japan had the longest time for teachers to reach the highest salary, taking 37 and 34 years, respectively. They also started with the lowest initial salaries, with an average of $30,500 for teachers in Korea and $28,000 in Japan.
May be you're good at English. For me, I hate English. It make me to know some video about 🔞, like xvideos, pornhub......with angle little mina_69LOL You are a fucking smart ass. But unfortunately that's not how to study the language.
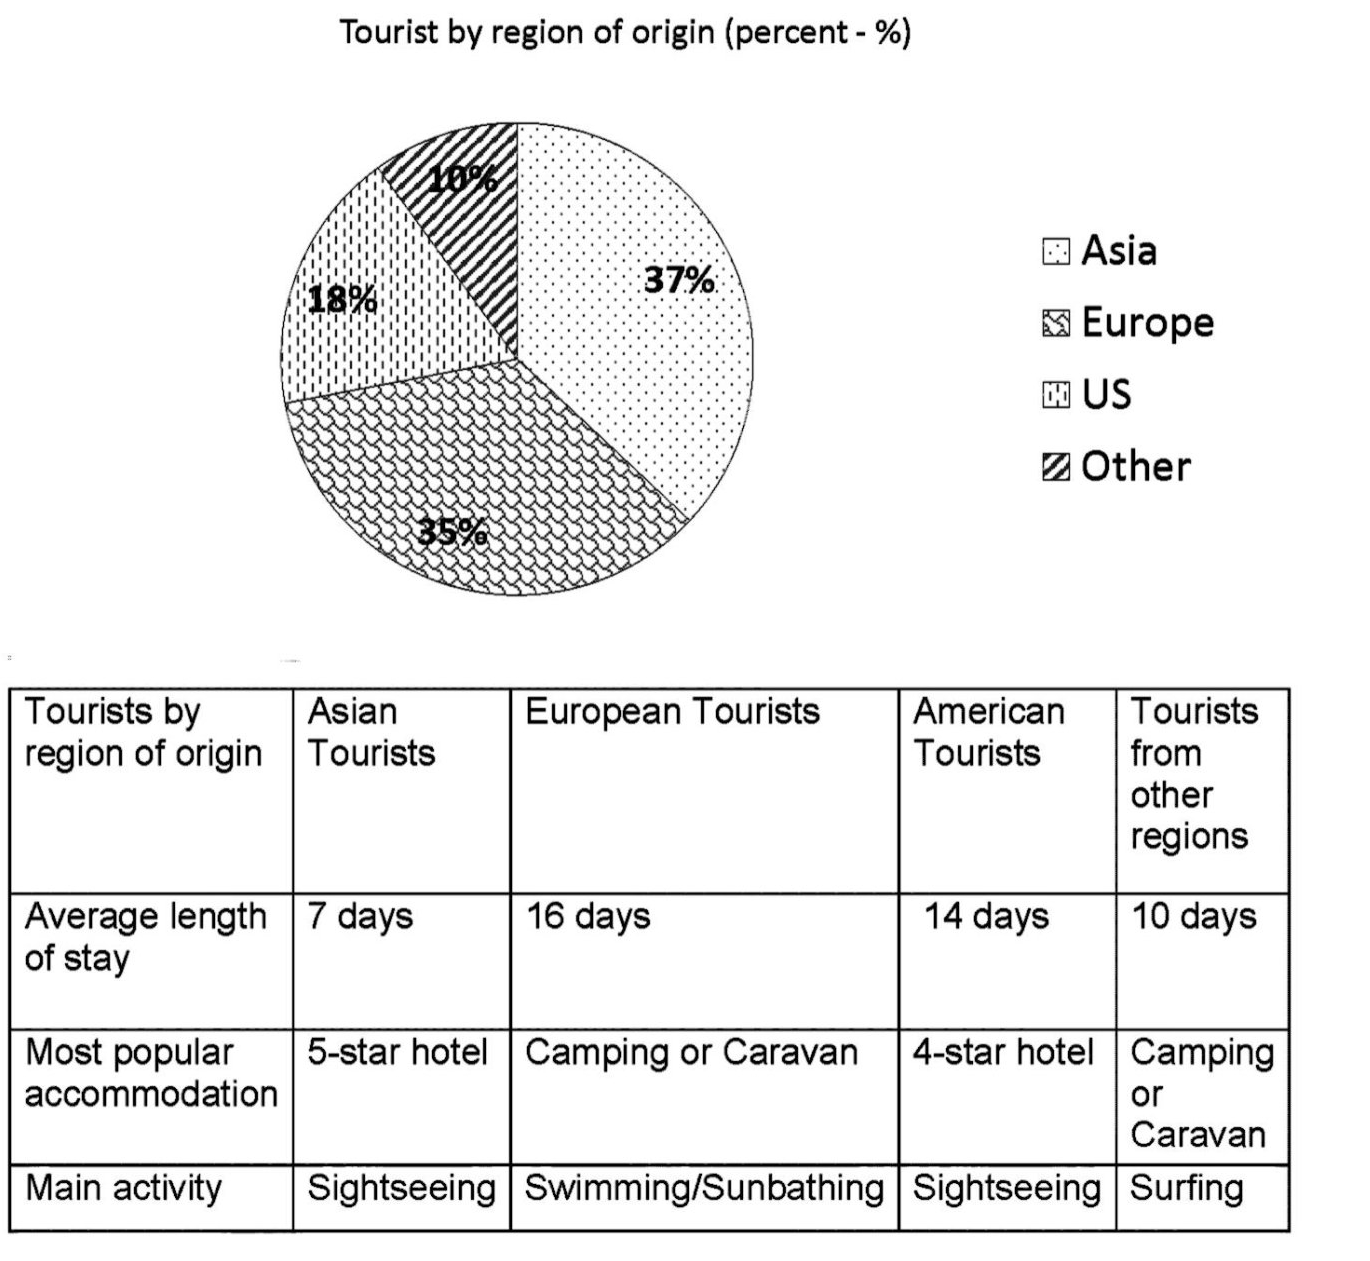
The graph and table demonstrate how travellers from different regions allocate their time for their vacation in Australia.
In summary, Asia and European together account for more than 72% of total tourists. Furthermore, Asia and American travellers have many similarities in their preference.
It is evident that Asia travellers spend the least time for their holiday, with only 7 days. On the other hand, European and American tourists stay more than double in comparison to the Asian encounters, with 16 days and 14 days of average length of stay respectively.
Interestingly, Asia and American tourists share many things in common in the way they spend their time for. These travellers prefer to choose luxurious hotels for their accommodation and like to go sightseeing as their main activity. Conversely, the other travellers are reported to often stay in Camping or Caravan, and like water-related activities: the European love swimming or sunbathing while tourists from other parts like to go surfing.
@TatHuan @xamvner234 @horus @suchawanderer
suchawanderer
Thanh niên hoi
stay more double.. thiếu tự nhiên
The graph and table demonstrate how travellers from different regions allocate their time for their vacation in Australia.
In summary, Asia and European together account for more than 72% of total tourists. Furthermore, Asia and American travellers have many similarities in their preference.
It is evident that Asia travellers spend the least time for their holiday, with only 7 days. On the other hand, European and American tourists stay more than double in comparison to the Asian encounters, with 16 days and 14 days of average length of stay respectively.
Interestingly, Asia and American tourists share many things in common in the way they spend their time for. These travellers prefer to choose luxurious hotels for their accommodation and like to go sightseeing as their main activity. Conversely, the other travellers are reported to often stay in Camping or Caravan, and like water-related activities: the European love swimming or sunbathing while tourists from other parts like to go surfing.
@TatHuan @xamvner234 @horus @suchawanderer
k dùng interestingly trong task 1
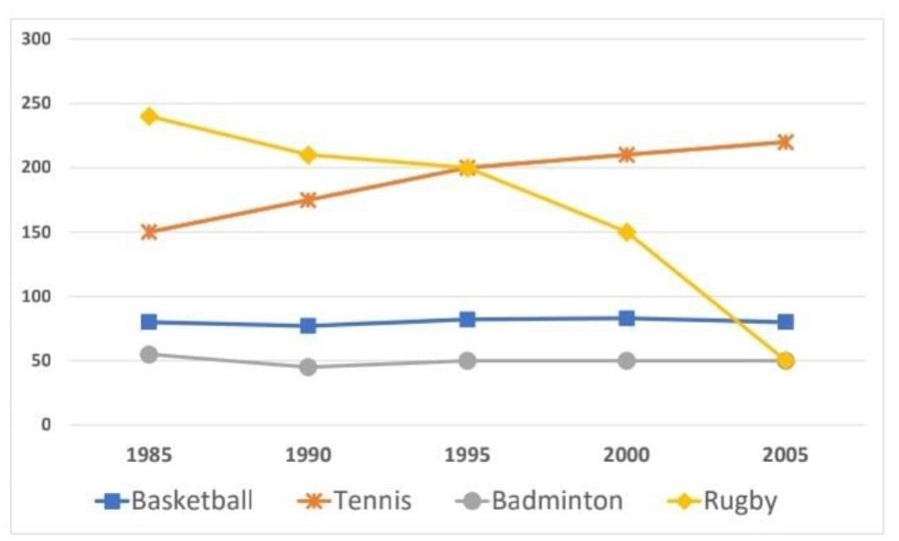
The line graph compares the total number of attendants playing in 4 different sports in a region from 1985 to 2005.
In overview, the number of players in Rugby and Tennis experienced significant changes during the period. On the other hand, Basketball and Badminton figures stayed roughly unchanged.
In 1985, it is evident that Rugby was the most popular sport in the region, with nearly 250 people playing, followed by Tennis with 150 players. Basketball and Badminton were the least attractive sports, with only approximately 75 and 50 people respectively.
From 1985 to 1995, it is noticeable that tennis experienced a growth in total players while Rugby gradually lost its popularity. In 1995, they eventually shared the same number of 200 attendants. In the following 10 years, Tennis continued to rise and became the leading sport, attracting nearly 225 people. On the other hand, Rugby witnessed a significant drop, to just 50 players in 2005. During this period, Badminton and Basketball fluctuated slightly and showed little change in their figures.
18 mins only
xamvner234
Bò lái xe
mày phải viet nhanh hơn nữa, vị chi là cỡ 15-20p cho task 1 thôi, còn lại còn bào task 2
The line graph compares the total number of attendants playing in 4 different sports in a region from 1985 to 2005.
In overview, the number of players in Rugby and Tennis experienced significant changes during the period. On the other hand, Basketball and Badminton figures stayed roughly unchanged.
In 1985, it is evident that Rugby was the most popular sport in the region, with nearly 250 people playing, followed by Tennis with 150 players. Basketball and Badminton were the least attractive sports, with only approximately 75 and 50 people respectively.
From 1985 to 1995, it is noticeable that tennis experienced a growth in total players while Rugby gradually lost its popularity. In 1995, they eventually shared the same number of 200 attendants. In the following 10 years, Tennis continued to rise and became the leading sport, attracting nearly 225 people. On the other hand, Rugby witnessed a significant drop, to just 50 players in 2005. During this period, Badminton and Basketball fluctuated slightly and showed little change in their figures.
18 mins only
The line graph compares the total number of participants in four different sports in a specific region from 1985 to 2005.
In the overview, it is evident that the number of players in Rugby and Tennis underwent significant changes during this period, while the figures for Basketball and Badminton remained relatively stable.
In 1985, Rugby emerged as the most popular sport in the region, boasting nearly 250 participants, followed by Tennis with 150 players. Basketball and Badminton, however, lagged behind, attracting only approximately 75 and 50 participants, respectively.
From 1985 to 1995, Tennis experienced a notable increase in its total number of players, while Rugby gradually lost its popularity. By 1995, both sports had an equal number of 200 participants. Over the subsequent decade, Tennis continued to gain momentum and eventually became the predominant sport, drawing nearly 225 participants. In stark contrast, Rugby witnessed a significant decline, dwindling to just 50 players by 2005. Throughout this period, the figures for Badminton and Basketball exhibited minor fluctuations, with little overall change.
Thank you tmlmày phải viet nhanh hơn nữa, vị chi là cỡ 15-20p cho task 1 thôi, còn lại còn bào task 2
The line graph compares the total number of participants in four different sports in a specific region from 1985 to 2005.
In the overview, it is evident that the number of players in Rugby and Tennis underwent significant changes during this period, while the figures for Basketball and Badminton remained relatively stable.
In 1985, Rugby emerged as the most popular sport in the region, boasting nearly 250 participants, followed by Tennis with 150 players. Basketball and Badminton, however, lagged behind, attracting only approximately 75 and 50 participants, respectively.
From 1985 to 1995, Tennis experienced a notable increase in its total number of players, while Rugby gradually lost its popularity. By 1995, both sports had an equal number of 200 participants. Over the subsequent decade, Tennis continued to gain momentum and eventually became the predominant sport, drawing nearly 225 participants. In stark contrast, Rugby witnessed a significant decline, dwindling to just 50 players by 2005. Throughout this period, the figures for Badminton and Basketball exhibited minor fluctuations, with little overall change.